Mon 3 Dec, 2018 to Tue 4 Dec, 2018
Foresight Centre, Liverpool, UK
The British Ecological Society Quantitative Ecology Group are hosting a two-day R workshop which will cover reproducible data manipulation and visualisation workflows in R. Day One will be focussed on the tidyverse, while Day Two will move into working with spatial data.
Day One: Data manipulation and visualisation in R using the tidyverse
Workshop leader: Gergana Daskalova, University of Edinburgh, Coding Club
The tidyverse collection of packages (tidyr, dplyr, ggplot2, broom and more) is a great tool for efficient data manipulation, visualisation and analysis. In this workshop, you’ll learn how to manipulate data using pipes, build functions and apply them in a pipe, summarise model output and visualise data analysis results. We’ll then delve into functional programming using purr. Along the way, we’ll be using large ecological datasets, so you will get hands-on experience with how you can tackle big data in ecology and achieve a lot in not that many lines of code. You’ll gain skills in customising different types of graphs to maximise the impact of your data visualisation and finally, we will be doing all of this under the Markdown framework for reproducible report to promote transparency in research.
Day Two: Spatial data manipulation and visualisation in R
Workshop leader: Reto Schmucki, Centre for Ecology and Hydrology
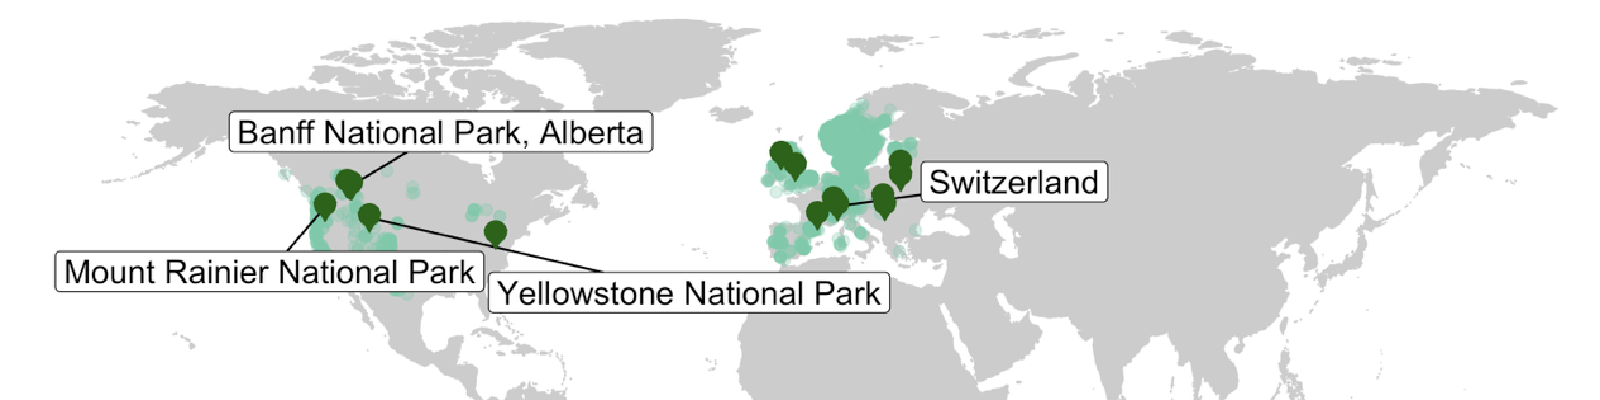
Geocomputing and manipulating geographic data are important skills for modelling spatial phenomena and have become increasingly important in data science. Over the last decade, there has been important progress in open-source GIS. In this workshop, you’ll learn how to create, import and manipulate spatial data, using the rich spatial ecosystem available in R (sf, sp, raster, tmap, leaflet). With emphasis on Simple Features for R available through the sf package. You will learn how to extract spatial information, merge complex data sets, visualise geographic data and produce interactive maps. Along the way, we’ll work on real-word data and explore how to harness the power of R and how it links to other open-source GIS solutions (QGIS, GRASS, PostGIS). At the end of this workshop, you will be able to implement a workflow to manipulate data, run analysis and visualise your results, using open-source solutions with a transparent and fully reproducible workflow.
The option is available to come to both days, or just one of the two. Lunch and refreshments will be provided.